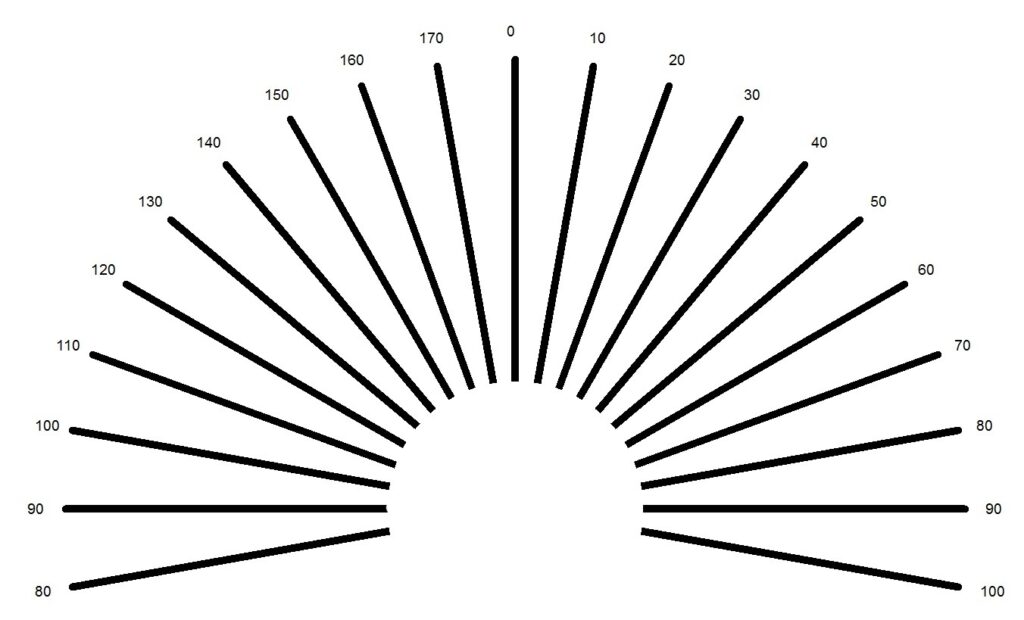
The astigmatism fan chart has line differences in 10 degrees intervals. Some charts have correcting cylinder axis marked in chart written at top of each spoke of line (Figure 1) and some charts just only represent the actual representation of line orientation in degree (Figure 2). We can easily find out whether correcting the cylindrical … Continue reading Astigmatism fan chart
